TL;DR
I built Synthbrew because I needed demo dashboards that behaved like production. CSV exports were static, Faker scripts became brittle, and endpoint mocks did not preserve relationships or state across screens. The answer was a real database seeded from a schema, plus a stable CRUD API and deterministic regeneration, so demos and QA environments stayed repeatable.
The moment the demo broke
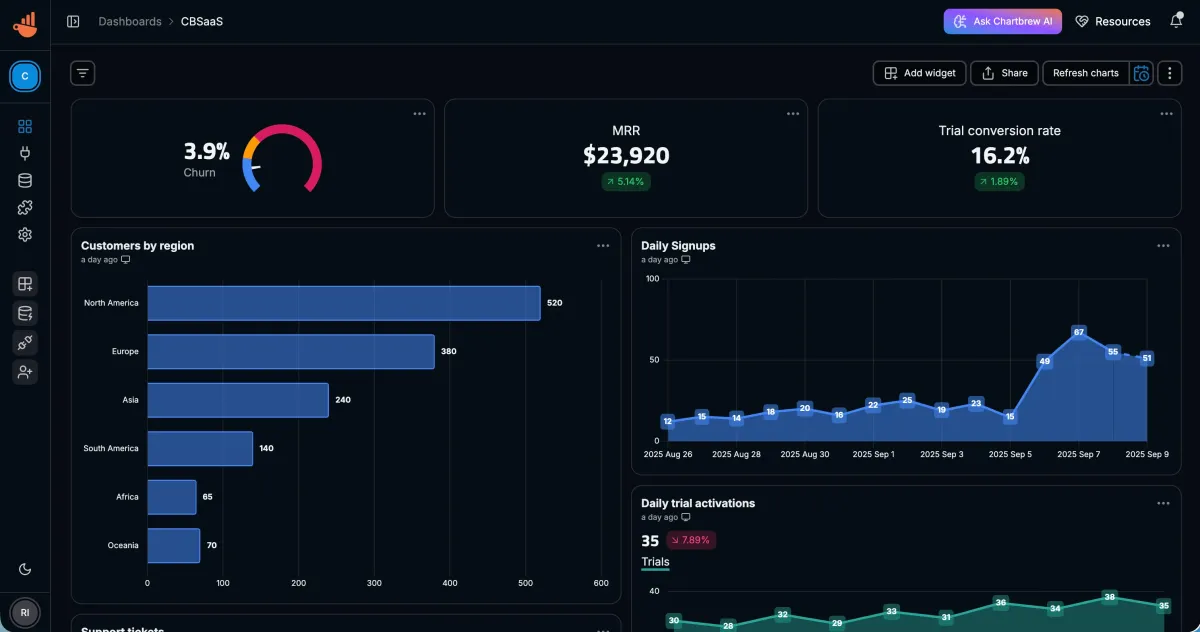
This started while I was building demo dashboards for Chartbrew.
Right before a call, one of the charts looked empty even though the UI logic was correct. The query was valid, the chart component was fine, and the endpoint returned data. The problem was the dataset itself: relationships did not reconcile the way the dashboard expected.
That moment was frustrating, but it was not surprising. I had already been stuck in the “cheap backend” trap for a while.
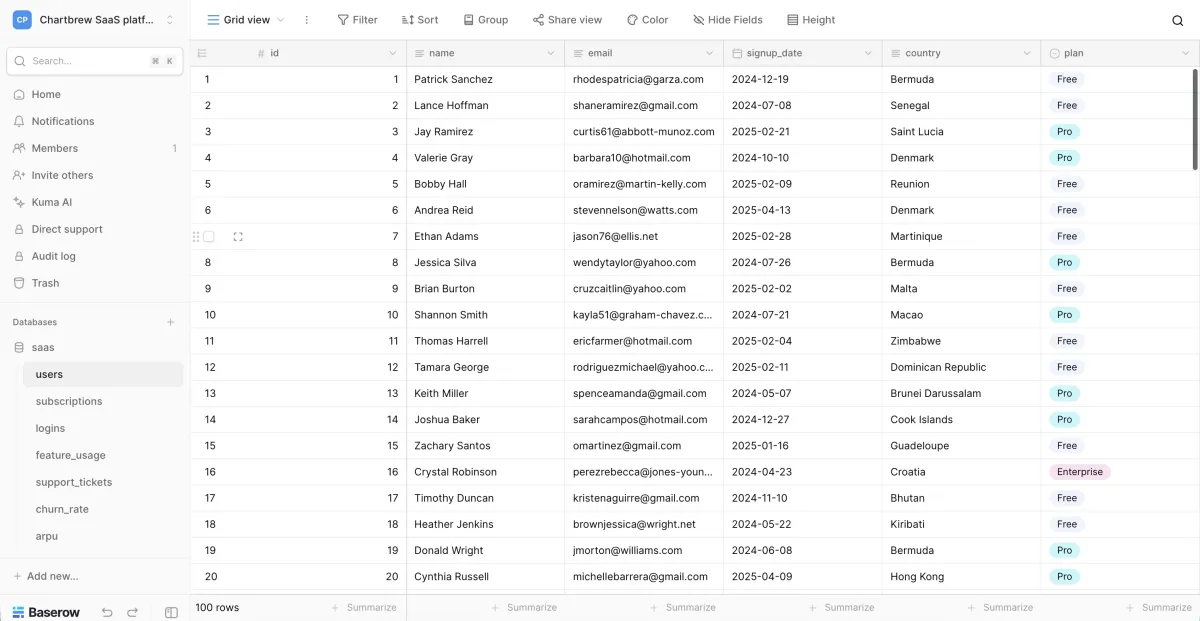
Before that demo break, I tried to avoid backend plumbing by using Airtable and Baserow as quick data APIs. It worked for the first prototype, then the time sink started:
I was manually designing tables and relationships, writing scripts and automations to keep records consistent, patching pagination and filters to mimic real behavior, and then cleaning or reseeding everything after each demo.
I was building a backend anyway, just inside a spreadsheet UI.
The kind of data dashboards actually need
Dashboards are stricter than they look. They need joins, history, and reconciliation.
A KPI card is a promise. If it says 1,200 active customers, your drilldown should explain 1,200. Time-series charts need continuity and cadence. Segment charts need correlations that make sense over time.
Even a minimal SaaS model makes this obvious: workspaces -> subscriptions -> invoices, plus views like revenue by plan and churn by cohort.
If those relationships or timelines are off, the dashboard stops feeling believable.
What I tried first and why it failed
I tried every common shortcut before deciding to build something else.
CSV and Mockaroo-style exports
Great for quick screenshots, weak for evolving products. A CSV is frozen the moment you export it, while dashboards need history, continuity, and evolving state.
Faker scripts
Fun at first, expensive later. As soon as you care about relations, constraints, skewed distributions, and lifecycle behavior, the script becomes a backend you now maintain.
Airtable/Baserow instant APIs
These felt like the fastest path because CRUD and UI came out of the box. In practice, they became a time tax. I spent too much time curating data, undoing demo-side effects, and writing glue logic for consistency and repeatability.
Endpoint mocks (MSW, Mirage, JSON stubs)
Useful at component level, but weak at system level. Each screen can look right in isolation while the product as a whole still feels inconsistent.
The key insight: stop mocking endpoints, mock the system
The category shift for me was simple: use a real database, generate data from a schema, keep regeneration deterministic with a seed, expose a stable CRUD API for frontend integration, and run isolated environments so different teams do not interfere with each other.
Frontend
  -> Runtime CRUD API
    -> Seeded Postgres source
That was the missing layer between fake rows and production backend.
The constraints that mattered
I did not want another generator that only optimizes for “more rows faster.” I wanted something that could survive real demo and QA workflows.
Joins and drilldowns had to reconcile, regeneration had to be deterministic, and multiple sources per schema had to stay isolated for Sales, QA, and edge-case testing. It also needed to be easier than manual Airtable/Baserow curation and flexible enough to support both runtime API integrations and direct Postgres query workflows.
The workflow I ended up with
This is the loop that finally worked:
- Define schema via SQL, visual modeling, or AI-assisted input.
- Create a source environment for the specific use case.
- Generate seeded relational data.
- Connect to get the data
- Connect frontend using runtime CRUD endpoints.
- Connect directly to Postgres to test BI tools like Chartbrew.
- Regenerate or reset the environment when needed.
That loop now fits naturally into early UI prototyping, demo dashboard builds, QA and visual regression runs, and preview environments.
Where Synthbrew fits
Synthbrew is the productization of that workflow.
It is built for teams that need more than static fixtures but do not want to build backend infrastructure just to unblock frontend work. You can model schemas, publish immutable versions, create isolated sources, generate seeded datasets, and connect through runtime CRUD with source API keys.
For deeper details, these pages map directly to that workflow: AI and DB schema import, schema modeling and immutable versions, seeded generation control, runtime API key auth, and read-only Postgres access.
I still use lightweight mocks for isolated components. But when a UI depends on joins, filters, and history, system-level mocking wins.
Closing rule
If your UI relies on data behavior, not just data shape, treat mock data like infrastructure.